Analytics & Dashboards · Marketing Strategy
EFB Monthly Primary KPI Dashboard
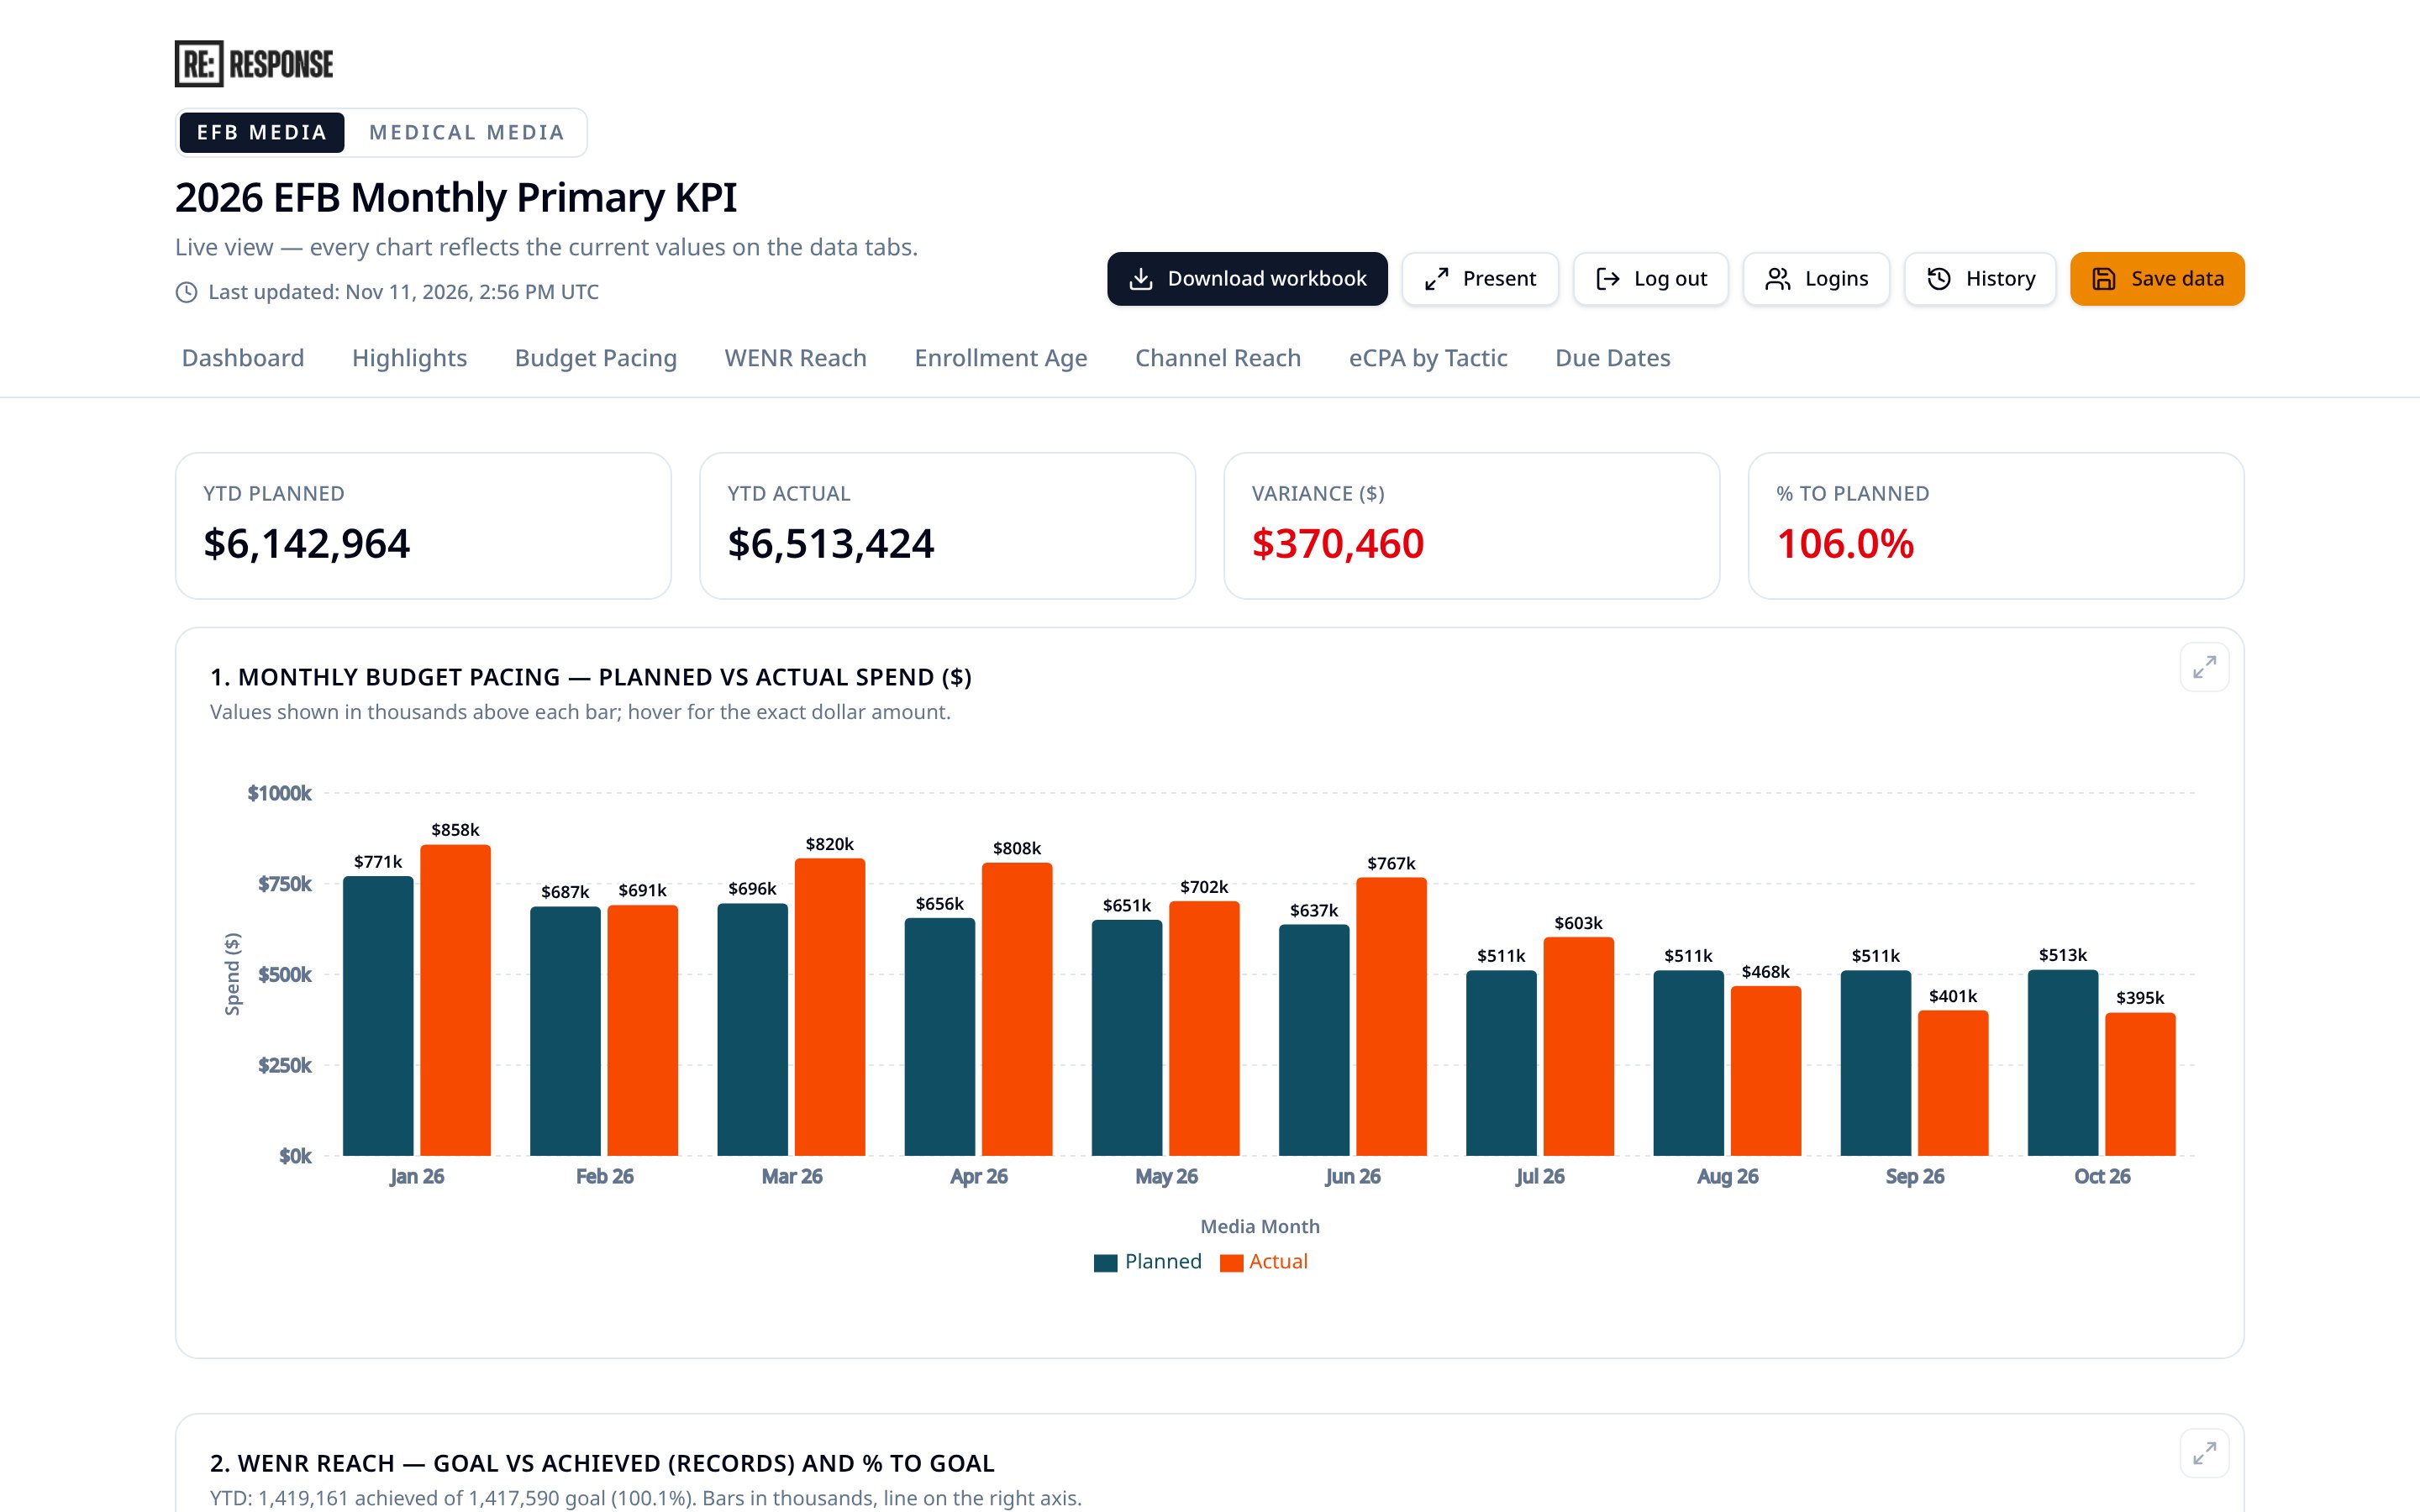
A live KPI dashboard tracking budget pacing, reach, enrollment and cost per acquisition across a multi-million dollar nutrition media program.
Live screenshot
Interactive preview
Deduplicated reach
1.4M
▲ 11.3% vs prior
Avg frequency
4.2x
▲ 3.2% vs prior
Pacing vs plan
98%
▼ 2.0% vs prior
Active partners
5
▲ 0.0% vs prior
Cumulative reach vs plan
Reach by partner
01
Business challenge
Monthly KPI reporting lived in a large workbook. Pulling planned vs. actual spend, reach and enrollment into a client view took days each month.
02
Strategic thinking
Keep the workbook as the source of truth and let every chart update from it, so the client always sees current numbers.
03
Solution
A password-protected dashboard with budget pacing, reach vs. goal, enrollment, channel reach, eCPA by tactic and due dates, plus workbook download and presentation mode.
04
Lessons learned
When the numbers update themselves, the monthly meeting becomes about decisions instead of data.
Process
- 01KPI definition with the brand team
- 02Workbook data mapping
- 03Dashboard build
- 04Monthly refresh process
Technologies
Results
Delivered and in use. Specific results are only published once they are verified.
Now accepting new clients
Let's look at your media plan together.
A 30-minute call to understand your goals, budget and where performance is stuck. No pitch deck required.